
Myth Busters: Do International Stocks (Still) Make Sense for Long-Term Investors?
After years of U.S. stocks besting international markets (and more of the same so far in 2022), investing internationally seems to have a bad rap among many U.S. investors. We explore and debunk three “myths” to show why we think international stocks should hold a place in most long-term portfolios.
Myth #1: Global diversification doesn't work anymore.
It’s no secret that U.S. stocks have had the upper hand on international markets for years —since around the start of the prior decade. To date, 2022 has been no different. The combined effect of U.S. stocks’ better performance and the strength of the US dollar drove the disappointing performance of international stocks. After what might feel like a very long period of U.S. market dominance, it’s fair for investors to wonder why they should bother investing both at home and abroad. To illustrate the value of global diversification at work, in Figure 1, we present rolling three-year returns for U.S., non-U.S. (developed and emerging), and global stocks from December 1990 through October 2022.
The dotted line represents global stocks. Whether U.S. or non-U.S. stocks have outperformed over any period, global stocks are always somewhere in the middle —neither the highest nor the lowest. This highlights the benefit of diversification for those that invest across global markets. Investors may avoid some potential downside in exchange for giving up some potential upside.
Figure 1 | Diversification at Work
3-Year Rolling Returns for Non-U.S, U.S. and Global Stocks
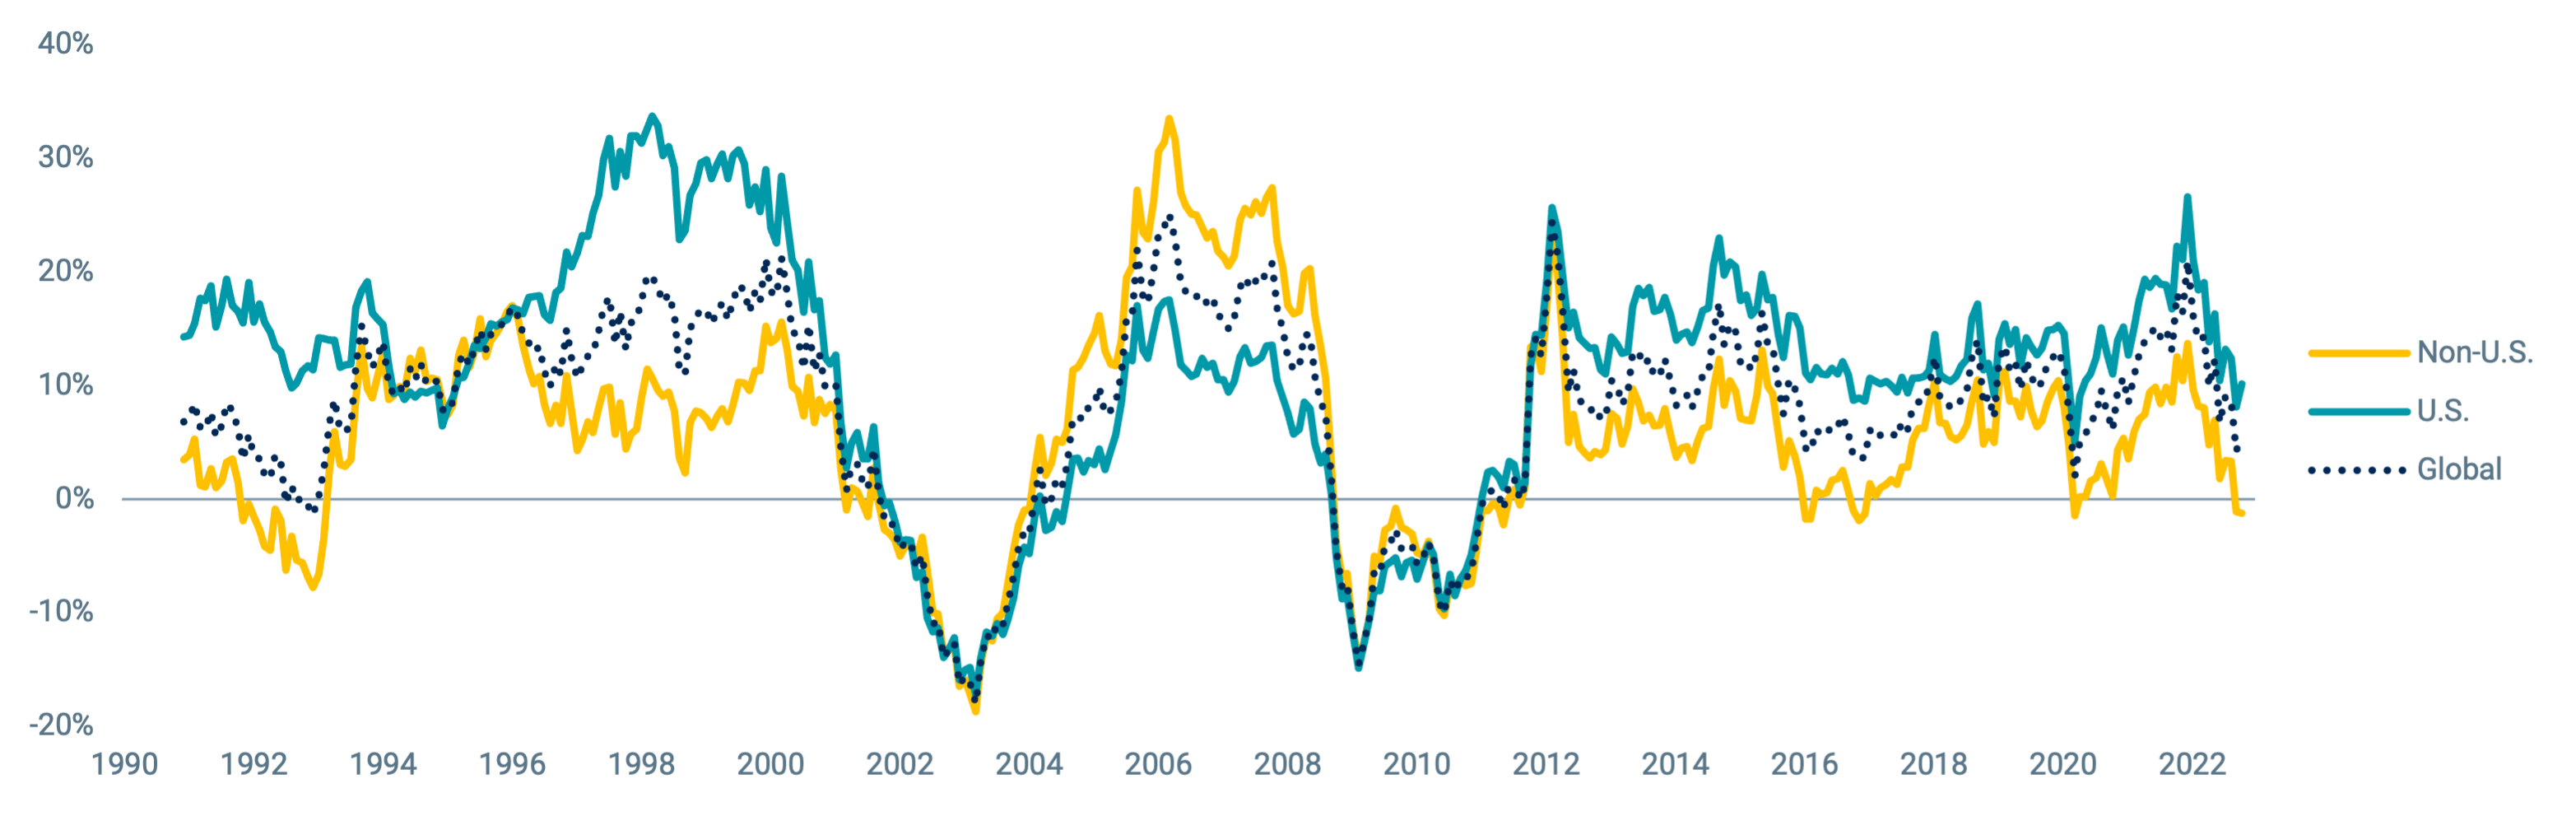
Data from 12/1/1990 – 10/31/2022. Source: Bloomberg. The MSCI USA Index represents U.S. stocks. The MSCI ACWI ex USA Index represents Non-U.S. stocks. The MSCI ACWI Index represents global stocks.Past performance is no guarantee of future results.
The three-year rolling returns have been highest for U.S. stocks more often, but there have also been long periods where non-U.S. stocks have been on top. For example, over the eight years from April 2002 through March 2010, 88 of the 96 three-year rolling periods were highest for non-U.S. stocks, with an average return difference of 6.7% annualized.
It’s easy to question non-U.S. stocks after the fact, but, as investors, we should be careful not to infer that past performance can predict what will happen next.
Consider an investor in the early 2000s. By looking at past performance, one could have made the wrong decision to favor U.S. stocks only to find out that non-U.S. stocks performed better shortly after.
Recent U.S. market outperformance has no bearing on what will happen going forward. Spreading your investments among both U.S. and non-U.S. markets still means your returns become less reliant on any single investment, thereby reducing “idiosyncratic” (i.e., diversifiable) risk in your portfolioMyth Busted
Myth #2: The U.S. market offers more than enough diversification.
It's true that the U.S. is the biggest global market, with thousands of listed companies. U.S. investors could surely build well-diversified portfolios without looking outside their home market.
And there’s been no shortage of bad news overseas in 2022. For example:
-
Effects of the Russian invasion of Ukraine
-
China’s “zero-COVID” policies weighing on production locally and abroad
-
Geopolitical risks
-
Many U.S. companies reshoring operations and supply chains
U.S. investors may now be even more likely to pass on non-U.S. markets. So, what are investors giving up by avoiding investments abroad? The short answer: quite a lot.
Figure 2 presents a snapshot of global markets, including each market’s current size and some current valuation metrics.
First, in the upper left section of the chart, we see that the U.S. market today represents about 60% of the global market capitalization. This means there’s still 40% of the total market opportunity set outside the U.S., representing thousands more companies across many developed and emerging markets with different expected returns potential.
Leaving 40% of the global market on the table introduces opportunity costs because the markets that are not held may perform better going forward. As we observed in Figure 1, this has happened for extended periods in the past.
Figure 2 | Global Market Capitalizations and Valuations

Data as of 11/24/2022. Source Avantis, Bloomberg, and Morningstar. MSCI indices represent regional and country markets. P/B (price-to-book ratio) is the market price of a stock divided by its book value. P/E (price-to-earnings ratio) is the price of a stock divided by its annual earnings per share.
We also show valuation metrics to highlight how they vary between U.S. and non-U.S. markets. While the risks in non-U.S. markets previously mentioned can cause concern, they may also contribute to why we generally see more attractive valuations for non-U.S. stocks compared to the U.S. market.
For ease of comparison, valuation metrics by region from Figure 2 have been placed into table form in Figure 3, along with additional sub-region data.
Across the board, we observe that non-U.S. stocks, whether developed or emerging markets, are trading at lower prices versus their fundamentals (e.g., price-to-book and price-to-earnings) compared to U.S. stocks. Lower P/B and P/E ratios may indicate more attractive expected returns for foreign stocks, at least in their local currencies.
The takeaway is that while non-U.S. markets provide access to many different economies, companies, and currencies, their lower valuations may also provide more upside potential.
Figure 3 | Current Non-U.S. Stock Market Valuations Are Attractive Compared to the U.S. Market
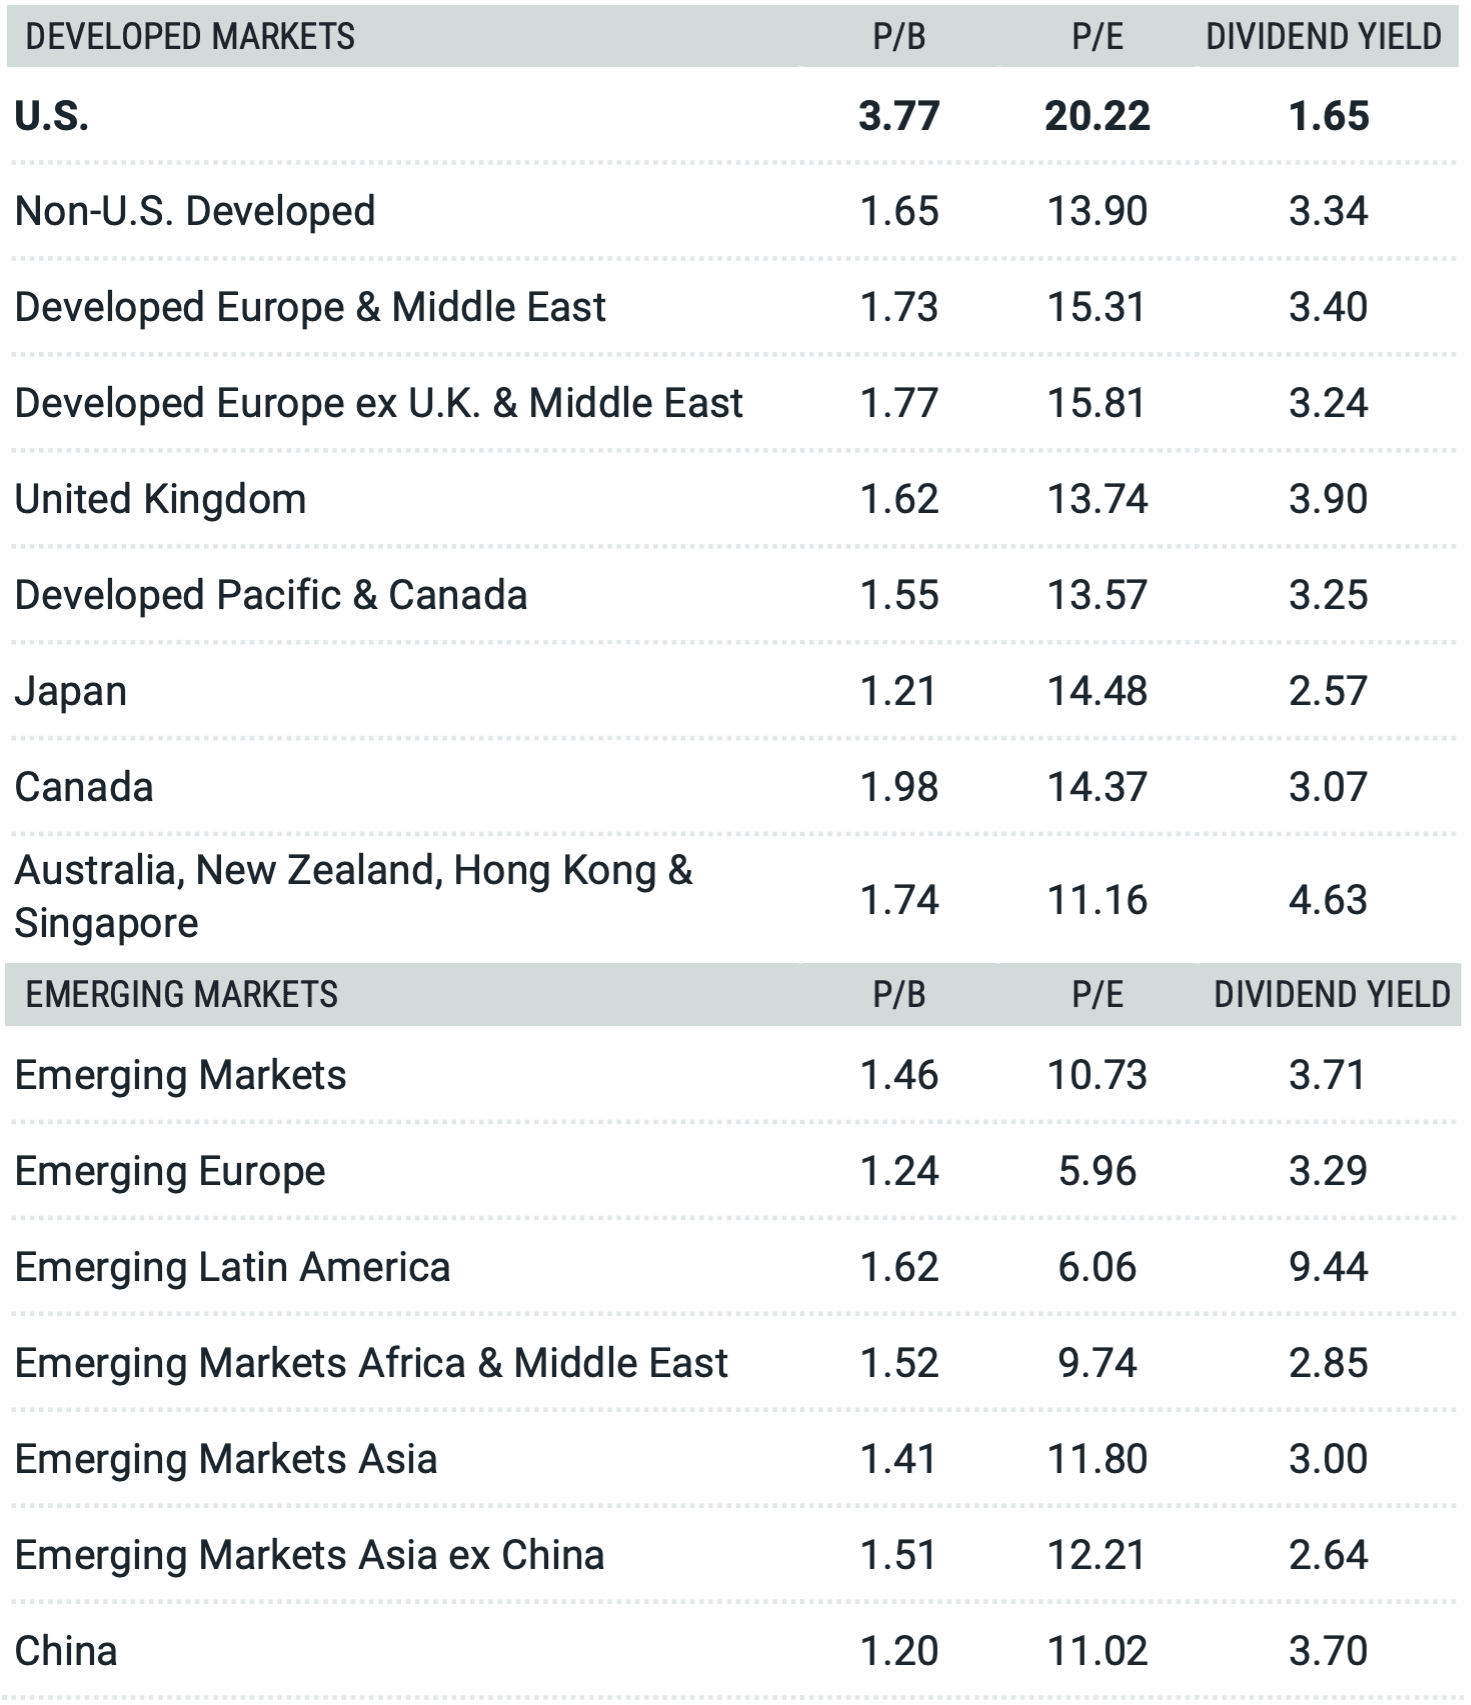
Data as of 11/24/2022. Source Avantis, Bloomberg, and Morningstar. Regions and countries are represented by their respective MSCI indices. P/B (price-tobook ratio) is the market price of a stock divided by its book value. P/E (price-to-earnings ratio) is the price of a stock divided by its annual earnings per share.
Let’s also not forget that the U.S. doesn’t win over every period, as we saw in Figure 1. In Figure 4, we offer a more granular view highlighting the difficulty of selecting the best market or region every year.
We present one-year returns going back more than 20 years for the U.S. and other non-U.S. regions and break out developed and emerging markets. Each row within the chart is sorted to list markets by best to worst performing, from left to right.
We see no clear patterns in the results. While the U.S. is the best-performing market most often, these periods still make up less than 40% of the sample. The U.S. was also the worst-performing market nearly 25% of the time. All six regions shown were the best-performing market and the worst-performing market at least once. The value of diversification is clear.
Ignoring non-U.S. markets leaves a significant portion of the global market on the table because there are thousands of companies in many different countries and regions that have the potential to outperform over any given period.Myth Busted
Figure 4 | The Randomness of Markets
1-Year Periods Ending on November 30 of Each Year

Data from 12/1/1996 – 11/30/2022. Source: Bloomberg. EM Latam = MSCI Emerging Markets Latin America IMI Index. EM Asia = MSCI Emerging Markets Asia IMI Index. EM EMEA = MSCI Emerging Markets EMEA IMI Index. Dev. Asia = MSCI Pacific IMI Index. Dev. Europe = MSCI Europe IMI Index.Past performance is no guarantee of future results.
Myth #3: Currency is all that matters for determining non-U.S. market returns for U.S. investors.
Currencies move, and exchange rates can have big swings that affect non-U.S. stock returns. That’s certainly been the case in 2022. The U.S. dollar (USD) has strengthened considerably, reaching exchange rate levels not seen for many years.
The USD/yen exchange rate reached Y150/$1, the lowest level since 1990. The euro dropped to parity with the U.S. dollar and the British pound also depreciated dramatically. But is currency all that matters for outcomes for U.S. investors investing internationally? Hardly, but it definitely plays a role.
Figure 5 shows rolling three-year returns for non-U.S. stocks in both local currency and U.S. dollars. We also isolate the currency effect by showing the difference between the local currency and USD returns. We see that currency effects can play a meaningful role in unhedged non-U.S. stock returns.
Currency contributed about 10% on the high end over periods of a weakening dollar and about -10% on the low end over periods of a strengthening dollar. It’s also worth highlighting the similarity in the variability of returns in U.S. dollars or local currency, as currency movements didn’t drive any noticeable excess variability.
The currency effect on total returns shows that currency can help or hurt returns in U.S. dollars over any period. Still, it’s not the only or biggest factor in performance or its variability.
Figure 5 | Currency Effects on Non-U.S. Stock Returns
3-Year Rolling Returns for Non-U.S. Stocks in U.S. Dollars and in Local Currency

Data from 12/1/1990 – 10/31/2022. Source: Bloomberg. Non-U.S. Stocks are represented by the MSCI ACWI ex-USA Index.Past performance is no guarantee of future results.
So, what should investors make of this? They should be aware that, all else equal, periods of dollar strengthening contribute to the relative outperformance of U.S. versus non-U.S. stocks. Conversely, all else equal, a weakening dollar contributes to the relative outperformance of non-U.S. markets versus the U.S.
Currencies have high volatility, and their movement is unpredictable, just like future stock returns are unpredictable. At any time, they can swing in the opposite direction, as shown in Figure 5, helping or hurting foreign investments. We believe the best option for investors is to take the known benefits of global diversification rather than foregoing them over the uncertainty of exchange rates.
Currency can play a meaningful role in non-U.S. stock returns for U.S. investors, but it’s not the only factor. Currency movements can help or hurt returns. Spreading investments across markets and currencies can help reduce the impact when currency movements detract from non-U.S. stock returns.Myth Busted
The Bottom Line
Ignoring international markets comes at the cost of diversification. This doesn’t mean allocating to non-U.S. stocks at the same weight as the global market (about 40% today) is the right choice for everyone. There are many reasons why an investor may be better served by having a lower allocation to non-U.S. stocks, such as taxation and costs.
But we believe investors are best off making these decisions within the context of a long-term investment plan rather than based on myths inspired by emotion or recent events.
Glossary
MSCI ACWI Index: A capitalization-weighted index that is designed to measure the equity market performance of developed and emerging markets.
MSCI ACWI ex USA Index: A market capitalization-weighted index that is designed to measure the equity market performance of developed and emerging markets, excluding the United States.
MSCI Emerging Markets Asia IMI Index: Captures large-, mid-, and small-cap securities in China, India, Indonesia, Korea, Malaysia, the Philippines, Taiwan, and Thailand.
MSCI Emerging Markets EMEA IMI Index: Captures large-, mid-, and small-cap securities across 11 emerging markets countries in Europe, the Middle East, and Africa (EMEA).
MSCI Emerging Markets Latin America IMI Index: Captures large-, mid-, and small-cap securities in Brazil, Chile, Colombia, Mexico, and Peru.
MSCI Europe IMI Index: Captures large-, mid-, and small-cap securities across 15 developed markets countries in Europe.
MSCI Pacific IMI Index: Captures large-, mid-, and small-cap securities in five developed markets countries: Australia, Hong Kong, Japan, New Zealand, and Singapore.
Price to Book Ratio: Measures a company’s profits relative to its book value. A company's profits are generally calculated by subtracting operating expenses from its gross profit. Book value is generally a firm’s reported assets minus its liabilities on its balance sheet.
Price to Earnings Ratio (P/E): The price of a stock divided by its annual earnings per share. These earnings can be historical (the most recent 12 months) or forward-looking (an estimate of the next 12 months). A P/E ratio allows analysts to compare stocks on the basis of how much an investor is paying (in terms of price) for a dollar of recent or expected earnings. Higher P/E ratios imply that a stock's earnings are valued more highly, usually on the basis of higher expected earnings growth in the future or higher quality of earnings.
Tags: stocks, long-term investing